The new Nrlyze portal · For property owners and managers
See how your properties are doing. And what to do about it.
Thousands of measurement points become a 3D model of the building: where the heat is lost, where the indoor climate is poor, which measure pays for itself first.
Book a demo
We get back to you within one working day. Free of charge, no commitment.
Thank you!
What our customers say
“With Nrlyze we can guarantee our customers that the heating system in their property runs optimally, and when it does not, we can identify what needs to be done much more easily.”
“We have achieved savings of 20% of our energy consumption. The biggest gain has been the time saved.”
How it works
We measure
Wireless sensors take about a minute per apartment to install, or we integrate the sensors you already have. Every room becomes a measurement point.
The building is modelled
Measured data becomes a 3D model of how the property actually behaves: where the heat is lost, where the indoor climate is poor, where the system works against itself.
You see what to do
The heating system is calibrated automatically and cuts the cost by 10–20%. The portal shows what remains, and which physical measure pays for itself first.
Already have connected sensors? We integrate them into our analysis service: the same optimisation, a shorter lead time.
One platform, four modules
Optimise
CalibrationAdjusts the heating curve automatically for outdoor temperature, sun and humidity, around the clock. The indoor temperature stays even across the year instead of swinging with the season, and you stop overcompensating with unnecessary heat.
Balance
Targeted measuresIdentifies which apartments get too much heat and which get too little, and how large the difference is. You see exactly where in the property the work is needed and can fix that one point, instead of adjusting the whole system on a guess.
Realtime
Decision supportShows the actual temperature, room by room, at any time. A complaint about the cold can be confirmed or dismissed in ten seconds, and work can be prioritised by measured values instead of by who complains loudest.
Performance
Follow-upCompares consumption before and after each measure, corrected for degree days. You see what an investment actually returned, and can compare properties against each other to see where the next effort does the most good.
The new portal shows the problems. Not just the readings.
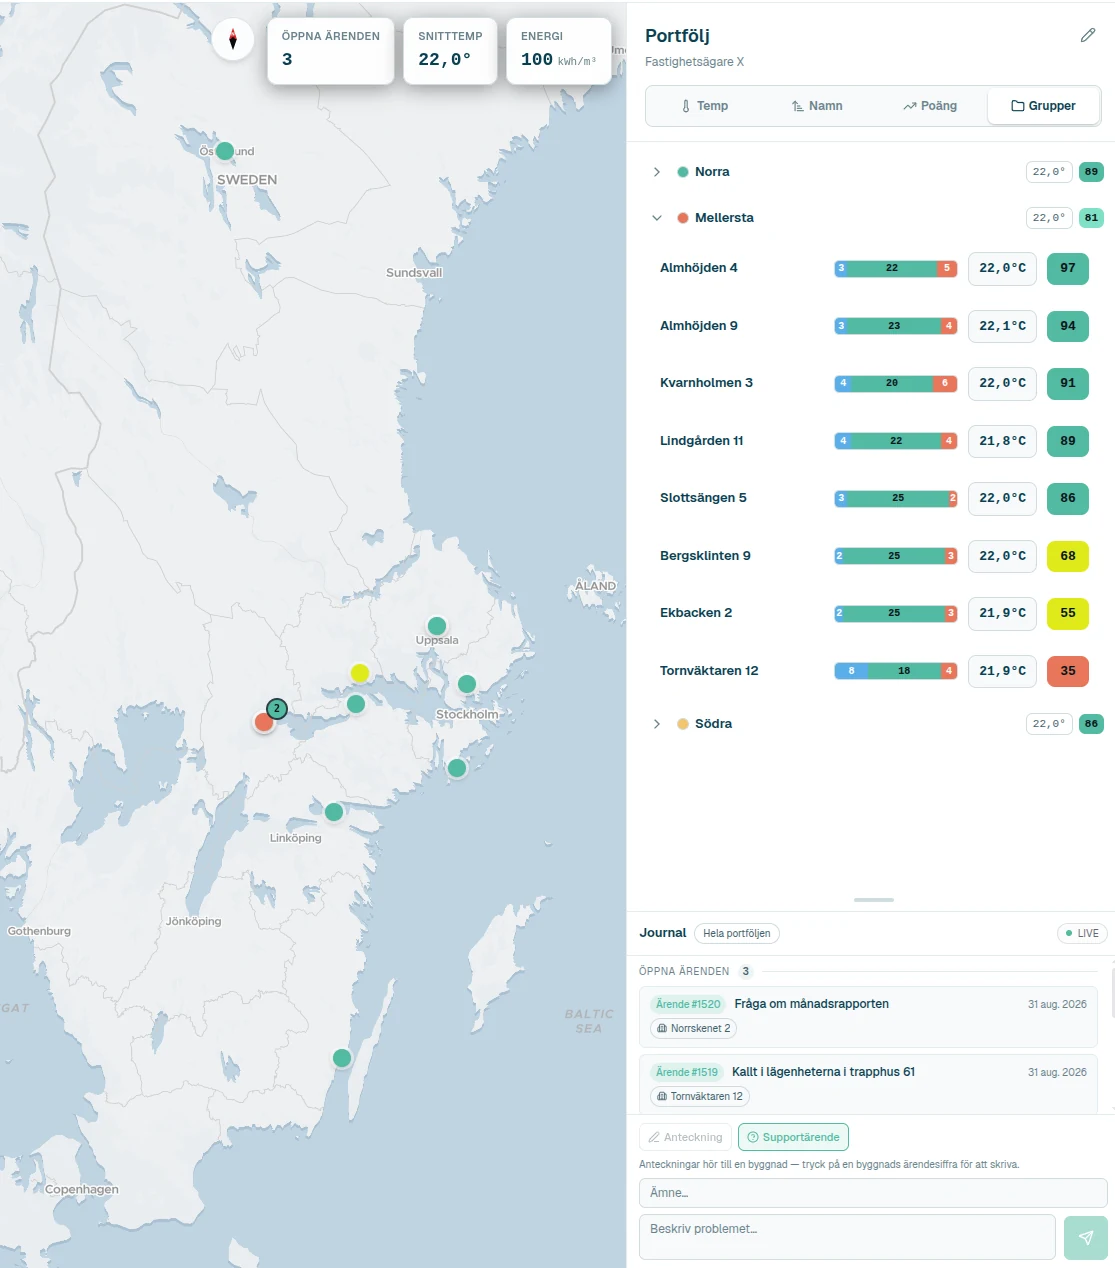
Open the portfolio and see straight away which properties need attention: score, temperature distribution and open tickets per building. Click into a building and the 3D model shows where it deviates, floor by floor.
- Portfolio overviewEvery property on a map, grouped the way you want, with a score and the share of cold, normal and warm apartments per building. The list sorts itself so the property that needs you most ends up at the top.
- 3D model with deviationsClick into a building and see every space coloured by whether it is cold, balanced or warm. The portal reads the pattern and suggests a likely cause, so you know whether to look at the façade, the risers or the heating system before sending anyone out.
- Journal and ticketsDeviations become tickets with the property log, sensor logs and support in the same thread. The history follows the property, not the manager who had it last year.
- PerformanceMonthly consumption against a reference period: savings in kWh, currency and CO₂, per property or across the whole portfolio.
Temperature and humidity in every apartment, all year round
Wireless sensors on their own mesh network. Easy to install, move and add to: scan with the app, name it, stick it on the wall. Done.
- Every sensor relays the readings of the others, so the network covers the whole building with no extra installation.
- If a resident moves out or won’t let you in, the sensor can be moved or added later. The model builds on the pattern across the building, not on every single apartment being covered.
- Your existing sensors can be used instead, and the data is yours. Open REST API and MQTT, compatible with other manufacturers’ systems.
You know what your properties cost. Now you can see why.
Book a walkthrough and we will go through your portfolio in the portal and show what measured data would say about your buildings.
Or call Nicolas Paanalahti on +46 73 703 42 11.